How to Boost ROI vs ROAS: Key Metrics for Performance Marketing
I hope that in this year to come, you make mistakes. If you are making mistakes…you’re Doing Something. “
Marketing success depends on accurate measurement, yet many businesses struggle to differentiate between ROI vs ROAS when evaluating their campaigns. These two critical metrics serve different purposes in performance marketing, and understanding their distinct roles helps companies make better decisions about their advertising investments. Choosing the right metric directly impacts campaign optimization and budget allocation strategies.
This comprehensive guide examines the key differences between ROI and ROAS, providing clear formulas and practical examples for both calculations. We explore essential performance marketing metrics, including cost per lead, customer lifetime value, and conversion rates. The article also presents proven strategies for improving both ROI and ROAS through effective digital media planning, targeting optimization, and systematic testing approaches.
Understanding ROI and ROAS
Understanding the fundamental differences between return metrics is crucial for effectively measuring marketing performance. Let’s explore these essential measurements in detail.
Definition of ROI
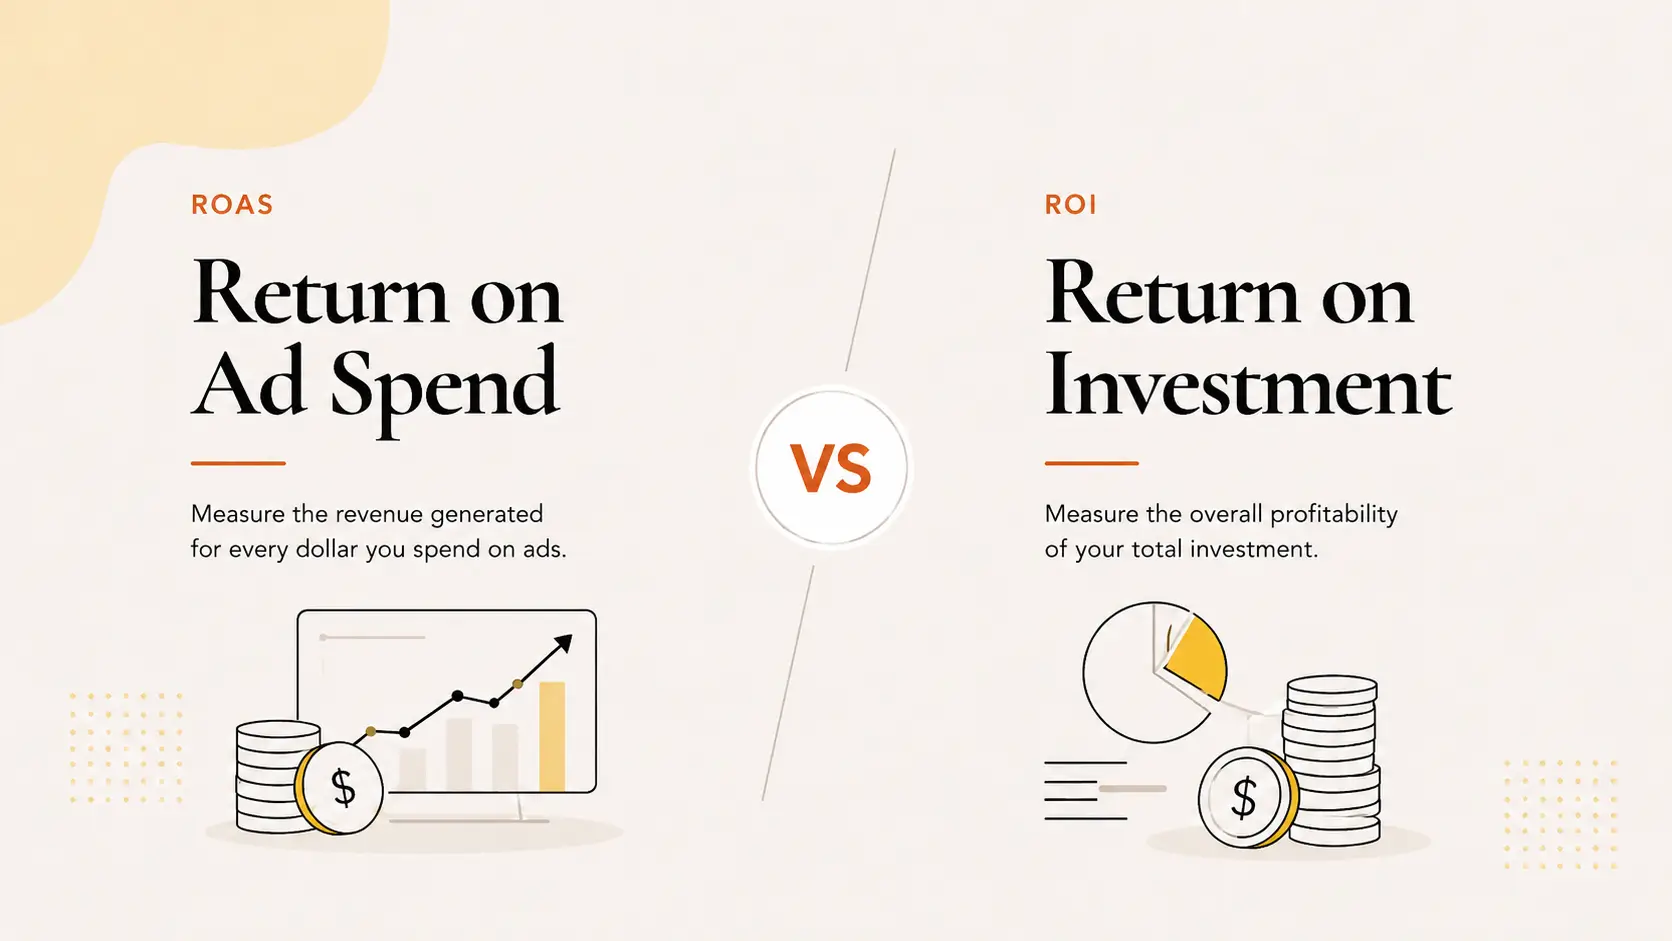
Return on Investment (ROI) measures how your expenditures contribute to your company’s bottom line. It evaluates the total return of overall investment by comparing net profits to total costs. ROI considers all operational expenses, including software licenses, office costs, vendor fees, and staff costs.
The basic ROI formula is:
ROI = [(Revenue – Total Costs) / Total Costs] × 100
For example, if your marketing campaign generates $100,000 in sales with total costs of $70,000 (including advertising, production, and operational expenses), your ROI would be:
ROI = [(100,000 – 70,000) / 70,000] × 100 = 42%
Definition of ROAS
Return on Ad Spend (ROAS) specifically measures the effectiveness of digital advertising efforts. Unlike ROI, ROAS focuses solely on the revenue generated from advertising spend, making it particularly valuable for evaluating specific campaign performance.
The ROAS formula is straightforward:
ROAS = Revenue from Ad Campaign / Cost of Ad Campaign
For instance, if you spend $500 on advertising and generate $2,500 in revenue, your ROAS would be 5:1, indicating that for every dollar spent on advertising, you earned $5 in revenue.
Key differences between ROI and ROAS
Here are the critical distinctions between these performance metrics:
- Scope of Measurement
- ROI: Evaluates overall profitability including all business costs
- ROAS: Focuses exclusively on advertising spend effectiveness
- Strategic Application
- ROI: Better for long-term profitability assessment
- ROAS: Ideal for optimizing short-term advertising strategies
The relationship between these metrics can be understood through this comparison:
Aspect ROI ROAS Purpose Overall profitability Ad campaign efficiency Costs Included All operational expenses Direct ad spend only Time Frame Long-term focus Campaign-specific Primary Use Strategic planning Campaign optimization While ROAS provides immediate insights into advertising effectiveness, ROI offers a comprehensive view of business performance. Performance marketers often use both metrics in tandem to make informed decisions about campaign optimization and budget allocation.
Calculating ROI and ROAS
Mastering the calculation of performance metrics is essential for optimizing your marketing campaigns. Let’s dive into the practical aspects of computing both ROI and ROAS to make data-driven decisions.
ROI formula and example
The comprehensive ROI formula for performance marketing is:
ROI = [(Revenue – Total Marketing Costs) / Total Marketing Costs] × 100
Consider this real-world example: A retail group launches a digital marketing campaign for their summer collection. The campaign generates $100,000 in sales, with $25,000 spent on advertising and additional costs of $45,000 for software, project management, and design.
Calculation:
ROI = [(100,000 – (25,000 + 45,000)) / 70,000] × 100 = 42%
ROAS formula and example
The ROAS formula focuses specifically on advertising spend:
ROAS = (Revenue from Ad Campaign / Cost of Ad Campaign) × 100
For instance: An e-commerce business spends $500 on online product advertising and generates $2,500 in revenue.
Calculation:
ROAS = (2,500 / 500) × 100 = 500% or 5:1 ratio
Industry benchmarks suggest a 4:1 ratio (400%) as a healthy ROAS, though this varies by sector and business model.
When to use each metric
Choose your metric based on these key considerations:
- Campaign Evaluation
- Use ROAS for: Individual ad performance, platform comparison, immediate campaign adjustments
- Use ROI for: Overall marketing strategy, long-term profitability assessment, budget planning
Here’s a practical comparison table for metric selection:
Business Need Recommended Metric Why Choose This Platform Performance ROAS Direct comparison of ad spend effectiveness Budget Planning ROI Accounts for all marketing investments Campaign Optimization ROAS Quick assessment of ad performance Strategic Planning ROI Comprehensive view of marketing impact For performance marketing success, consider using both metrics in tandem. ROAS provides quick insights for campaign optimization, while ROI offers a broader perspective for strategic decision-making. The break-even point for ROAS varies by industry, but maintaining a ratio above 3:1 generally indicates effective ad spend management.
Key Metrics for Measuring Marketing Performance
Beyond ROI and ROAS, successful performance marketing relies on tracking several key metrics that provide deeper insights into campaign effectiveness. Let’s explore the essential measurements that help optimize your digital media planning and buying strategies.
Cost per Lead (CPL)
Cost per Lead measures the financial efficiency of your lead generation efforts. This metric helps evaluate campaign profitability and guides budget allocation decisions. The formula is:
CPL = Total Marketing Cost / Number of Leads Generated
For example, if a campaign costs $5,000 and generates 200 leads, the CPL would be $25. Industry benchmarks vary significantly, but most B2B businesses aim to maintain CPL below $100. This metric directly impacts your overall ROI and helps optimize performance marketing strategies.
Customer Lifetime Value (CLV)
Customer Lifetime Value represents the total revenue expected from customers throughout their relationship with your business. CLV is calculated using:
CLV = Average Customer Value × Average Customer Lifespan
A practical example: If a customer spends $50 per purchase, makes 5 purchases annually, and remains active for 3 years, their CLV would be $750. Understanding CLV is crucial for:
- Determining acceptable customer acquisition costs
- Setting appropriate marketing budgets
- Evaluating long-term campaign performance
Conversion Rate
Conversion rate indicates the percentage of visitors who complete desired actions, making it a vital metric for performance marketing. The calculation is straightforward:
Conversion Rate = (Number of Conversions / Total Visitors) × 100
A 2023 survey revealed an average conversion rate of 2.9% across industries. However, “good” conversion rates vary based on:
Factor Impact on Conversion Rate Industry Different benchmarks by sector Traffic Source Varies by channel quality Campaign Type Different goals need different targets Target Audience Demographics affect conversion Average Order Value (AOV)
Average Order Value tracks the typical purchase amount per transaction, helping optimize revenue without increasing traffic. Calculate AOV using:
AOV = Total Revenue / Number of Orders
Global ecommerce AOV exceeded $110 in September 2023. To improve AOV, consider these strategies:
- Implement strategic product bundling
- Offer volume discounts
- Create loyalty programs
- Use dynamic pricing
These metrics work together to provide a comprehensive view of your marketing performance. While ROI and ROAS measure overall returns, these supporting metrics offer specific insights for optimizing different aspects of your campaigns. By monitoring this complete set of metrics, performance marketers can make data-driven decisions to improve campaign effectiveness and drive sustainable growth.
Strategies to Improve ROI and ROAS
Implementing effective strategies to boost both ROI and ROAS requires a systematic approach to performance marketing optimization. Let’s explore proven techniques that can significantly improve your marketing returns across multiple channels.
Optimizing ad spend
Smart budget allocation starts with understanding your advertising costs and implementing efficient bidding strategies. The key to optimizing ad spending lies in:
- Real-time bid adjustments based on performance data
- Strategic budget allocation across channels
- Implementation of automated bidding tools
- Regular review and pause of underperforming ads
Consider this strategic framework for ad spend optimization:
Strategy Impact on ROI Impact on ROAS Smart Bidding Reduces overall costs Improves ad efficiency Budget Distribution Maximizes resource utilization Enhances channel performance Automation Tools Reduces manual oversight Optimizes real-time spending Performance Analysis Identifies cost-saving opportunities Increases return per ad dollar Improving targeting and segmentation
Effective audience segmentation dramatically improves campaign performance by ensuring your message reaches the right people. STP (Segmentation, Targeting, and Positioning) marketing focuses on commercial effectiveness through:
- Demographic and psychographic segmentation
- Behavioral targeting based on user actions
- Interest-based audience creation
- Geographic and temporal targeting
Creating detailed customer personas helps identify valuable segments and develop personalized marketing approaches. This targeted approach typically results in higher conversion rates and improved return on marketing investments.
A/B testing ads and landing pages
Systematic testing is crucial for optimizing both ads and landing pages. A/B testing should focus on:
- Ad Elements:
- Headlines and copy variations
- Visual components and creative assets
- Call-to-action buttons
- Ad formats and placements
Landing page optimization through A/B testing requires a methodical approach to testing individual elements while maintaining statistical significance. Focus on testing one element at a time to measure the impact on conversion rates accurately.
Enhancing the customer journey
Understanding and optimizing the customer journey is fundamental to improving both ROI and ROAS. The journey typically consists of three crucial phases:
Awareness Phase (Top of Funnel)
- Implement broad targeting strategies
- Focus on educational content
- Build brand recognition
- Use cost-effective reach methods
Consideration Phase (Middle of Funnel)
- Develop targeted content strategies
- Implement newsletter opt-ins
- Create engaging shopping events
- Organize strategic giveaways
Decision Phase (Bottom of Funnel)
- Deploy product-specific ads
- Offer exclusive discounts
- Implement free shipping promotions
- Create urgency through limited-time offers
Each phase requires specific optimization strategies to maximize performance. For example, during the awareness phase, focus on reach and engagement metrics, while the decision phase should emphasize conversion optimization and sales metrics.
Performance marketing success depends on continuous monitoring and adjustment of these strategies. Regular analysis of key performance indicators helps identify opportunities for optimization and ensures that both ROI and ROAS continue to improve over time. By implementing these strategies systematically and measuring their impact, marketers can create more efficient campaigns that deliver better returns on their marketing investments.
Conclusion
Successful performance marketing requires mastery of both ROI and ROAS metrics, each serving distinct yet complementary roles in campaign evaluation. ROI provides the comprehensive view needed for strategic decision-making, while ROAS offers immediate insights into advertising effectiveness. These core metrics, supported by essential measurements like CPL, CLV, and conversion rates, create a complete framework for understanding and optimizing marketing performance across all channels.
Marketing success stems from the systematic application of proven optimization strategies, including precise audience targeting, continuous A/B testing, and careful attention to the customer journey. Companies that embrace data-driven decision-making and maintain focus on both immediate campaign results and long-term profitability position themselves for sustained growth in the competitive digital marketplace. Regular analysis of these key metrics enables marketers to refine their approaches and achieve better returns on their marketing investments


Leave a comment:
You must be logged in to post a comment.